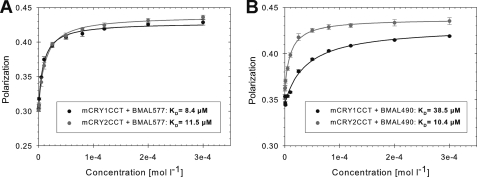
FIGURE 2.
Fluorescence polarization spectra for mBMAL1-mCRY1/2 interactions. Polarization values are plotted against the concentration of the mCRY titrant. mCRY1-(471–606) and mCRY2-(489–592) proteins were titrated into 500 nm solutions of Cy3.5 fluorescently labeled mBMAL1-(577–625) (A) and mBMAL1-(490–625) (B) proteins. mCRY concentrations are stepwise increased from 500 nm to 300 μm. The increasing polarization values document the formation of mBMAL1-mCRY complexes. KD values are in the μm range (see the insets). The experiments were reproduced at least three times with similar results. mCRY1/2CCT, mCRYCCtail fragments. BMAL577 and BMAL490, mBMAL1-(577–625) and mBMAL1-(490–625) fragments, respectively.

