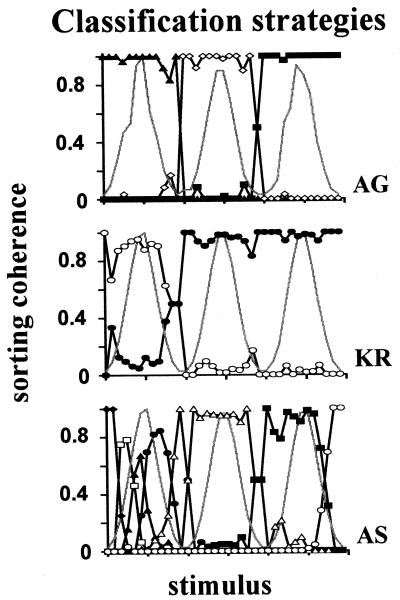
Figure 2.
Cross-subject classification strategy variability. Individual examples of classification strategies of three subjects during their fourth session classifying stimuli sampled from the three-peak distribution. Graphs present sorting coherence for each stimulus (fraction of presentations in a bin attributed to a class; each symbol represents a particular class). Gray curves plot, here and below, the relative presentation frequency in the session. Similar strategies were found for the four-peak and uniform cases. The stimulus range here and below is in bins.

