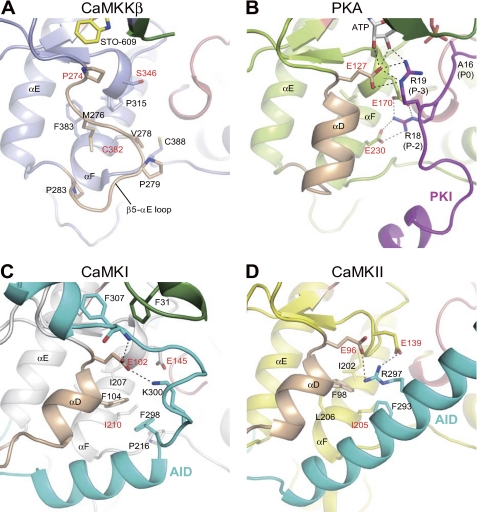
FIGURE 3.
Close-up views of the region surrounding the β5-αE loop of CaMKKβ (A) in comparison with the equivalent region of the PKA-PKI complex (B), CaMKI (C), and CaMKII (D). The coloring of the elements is the same as in Fig. 2. Hydrogen bonds are indicated as dashed lines.

