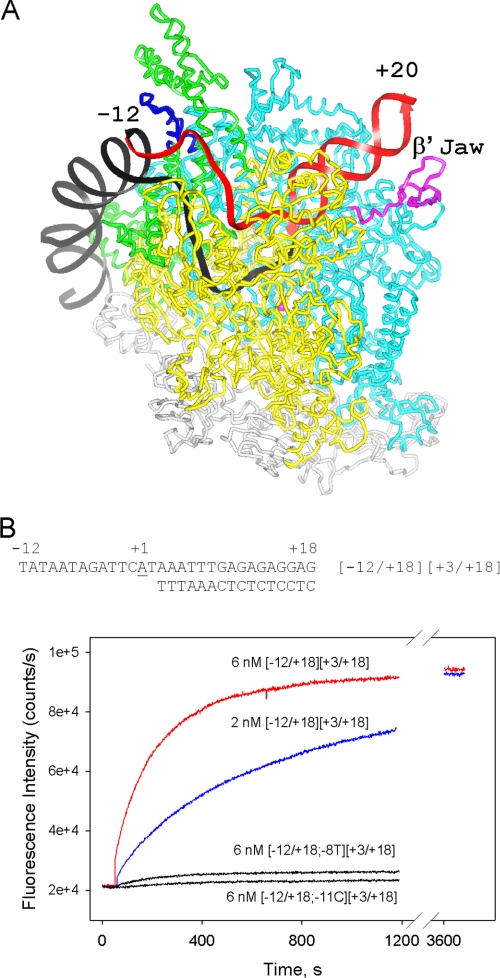
FIGURE 1.
Measuring RNAP-downstream fork junction interactions using the protein beacon assay. A, the likely location of a downstream fork junction promoter segment (in red) relative to a model of Thermus aquaticus RNAP-promoter open complex is shown. The colors of the RNAP subunits contacting the downstream fork junction segment are: yellow, β; cyan, β′; green, σ. The β′ jaw and conserved region 2.3 of σ are shown in magenta and blue, respectively. The model of the open complex structure is from Lawson et al. (51). B, time dependence of the increase in fluorescence upon mixing 1 nm (211Cys-TMR) σ70 holoenzyme beacon with downstream fork junction probes. The structure of the parental fork junction based on the T5N25 sequence is shown in the panel. In probe names, numbers in the left and the right brackets correspond to upper and bottom strands fork junction ends with respect to the transcription start position (+1); −8T and −11 C stand for a T at the −8 position and a C at the −11 position, respectively.

