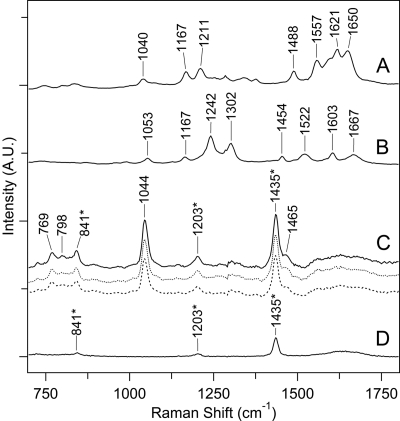
FIGURE 6.
UVRR spectra of chromophore-containing PSII peptides and model compounds. Spectra of kynurenine (A) and NFK (B) in water, recorded with 220 μW 229-nm laser excitation. C, spectra of the chromophore-containing peptides from HPLC fractions 1 (solid line), 2 (dotted line), and 3 (bold dotted line) (see supplemental Fig. S2B), recorded with 360 μW 325-nm laser excitation. The peptides were B5A-derivatized, purified both by HPLC and affinity chromatography, and suspended in H2O, 0.1% TFA. D shows the UVRR spectrum of H2O, 2% TFA only, and the bands assigned to TFA are indicated with a asterisk. The spectra were displaced by an arbitrary amount on the y axis for comparison. Each y axis mark corresponds to 6,500 arbitrary intensity units.

