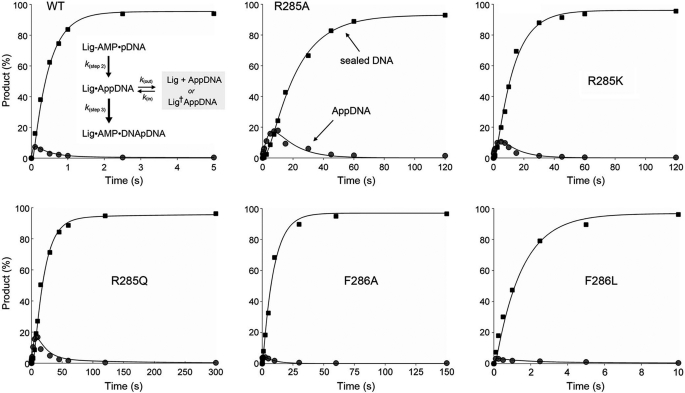
FIGURE 4.
Flux through DNA-adenylate to ligated product during single-turnover nick sealing. The distributions of 18-mer AppDNA intermediate (gray circles) and sealed 36-mer DNA (black squares) during single-turnover nick sealing by the indicated ChVLig-AMP proteins are plotted as a function of reaction time. Each datum in the graphs is the average of three separate kinetic experiments. The data were modeled in MATLAB to the kinetic scheme depicted in the top left panel, and the resulting curve fits are shown.

