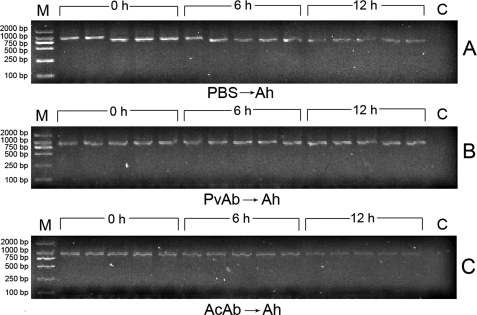
FIGURE 2.
PCR analysis of A. hydrophila 16 S rRNA gene. The 8-cell stage embryos were microinjected with live A. hydrophila, and five embryos were collected each time at 0, 6, and 12 h after the bacterial injection. Total DNAs were isolated from each embryo and used as template to amplify the specific region of A. hydrophila (Ah) 16 S rRNA gene. All the PCR products were electrophoresed in 1% agarose, and the bands were recorded using the gel imaging system. A, embryos injected with A. hydrophila only. B, embryos injected with anti-fish Pv antibody, followed by injection with A. hydrophila. C, embryos injected with anti-actin antibody, followed by injection with A. hydrophila. M, marker; C, control.

