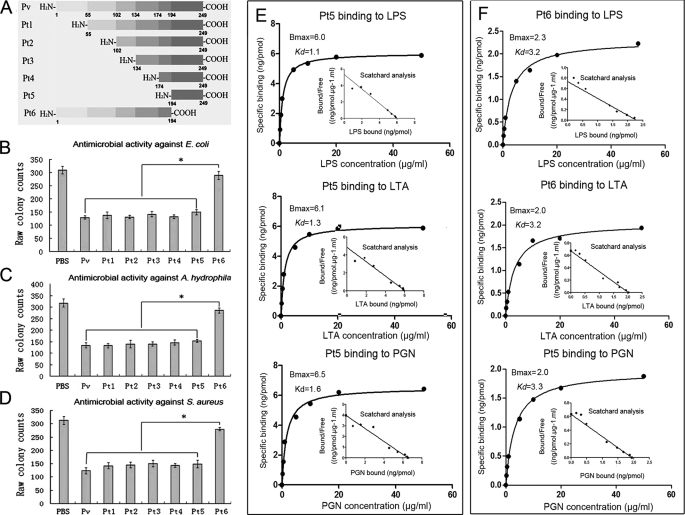
FIGURE 6.
Antimicrobial activity of truncated Pv peptides and their affinities to various ligands. A, diagram showing Pv truncation. B, antimicrobial activity against E. coli. C, antimicrobial activity against A. hydrophila. D, antimicrobial activity against S. aureus. E, saturation curve of the binding of Pt5 to LPS, LTA, and PGN. F, saturation curve of the binding of Pt6 to LPS, LTA, and PGN. BSA instead of recombinant Pv was used as control. The numbers in A indicated the positions at which Pv was truncated. Pt1(55–249), Pt2(102–249), Pt3(134–249), Pt4(174–249), Pt5(194–249),and Pt6(1–194) represented the truncated peptides. Data are expressed as mean values ± S.E. (n = 3). The bars represent the mean ± S.E. The asterisk means a significant difference (p < 0.05).

