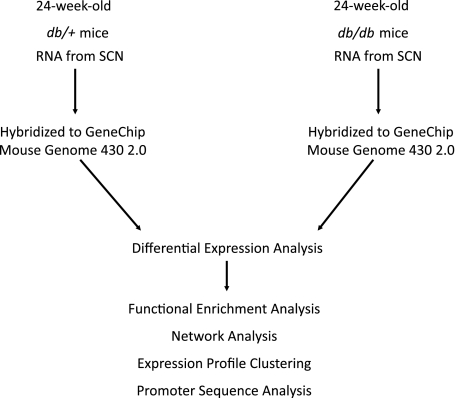
FIG. 1.
Transcriptional data analysis workflow. RNA samples obtained from the sciatic nerve (SCN) of db/db and db/+ mice were hybridized to Affymetrix GeneChip microarrays. Data quantified from scanned microarrays were analyzed to identify DEGs. Functional enrichment analysis of DEGs was performed to identify overrepresented biological categories and pathways. Network analysis identified functionally related subgroups of DEGs. Expression profile clustering identified subgroups of coexpressed DEGs. Promoter sequence analysis identified overrepresented TFBS modules in the promoter sequences of coexpressed genes.

