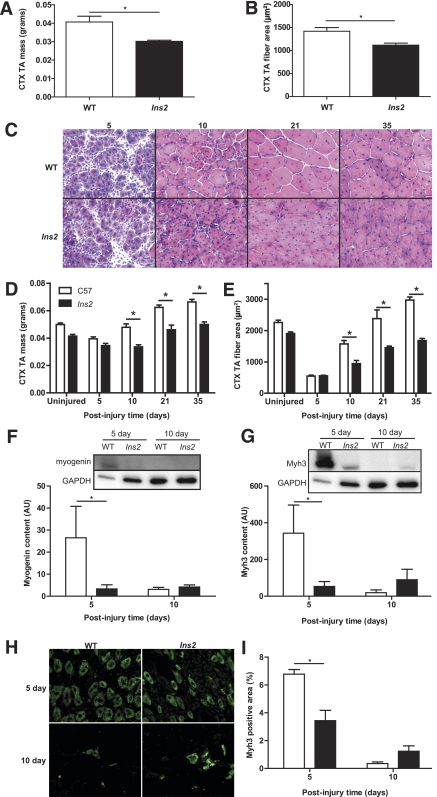
FIG. 1.
Type 1 diabetes impairs regeneration of skeletal muscle after CTX injury. Ten days after injury, TA muscle of the 1-week diabetic Ins2WT/C96Y mice demonstrates a significant loss of (A) mass (t test: P = 0.015; N = 3) and (B) myofiber cross-sectional area (t test: P = 0.014; N = 3) compared with WT, indicating impaired regeneration after injury at only 7 days of type 1 diabetes. C: Hematoxylin–eosin staining of TA injured at 8 weeks of type 1 diabetes demonstrates loss of (D) muscle mass (N = 16) and (E) myofiber area (N = 16) compared with WT beginning at 10 days postinjury. The uninjured time point in both panels is the contralateral TA to the 5-day post-CTX muscle and is included to illustrate the decrease in muscle mass and myofiber area associated with the impaired growth of skeletal muscle in the type 1 diabetic state. The values for the uninjured time point are not included in the statistical analysis. A main effect of diabetes (main effect: P < 0.001) is observed in both mass and fiber area with the asterisk (*) denoting specific differences between WT and Ins2WT/C96Y as defined by post hoc analysis. Note that the type 1 diabetic muscle does not return to WT mass/fiber size at later time points, but continues to lag in regeneration. Because early expression of myogenic proteins is critical to the early stages of regeneration, (F) myogenin (main effect: P = 0.062, interaction: P = 0.017; N = 8) and (G) embryonic myosin heavy chain (Myh3) expression (main effect: P = 0.117, interaction: P = 0.009; N = 8) were determined in quadriceps muscle and demonstrate significantly increased expression at 5 days postinjury in WT but not Ins2WT/C96Y (labeled Ins2, F and G). H: Immunofluorescent staining of injured TA with anti-Myh3 confirms (I) the lack of Myh3 positive fibers in Ins2WT/C96Y compared with WT (main effect: P = 0.013; interaction: P < 0.001; N = 8) at 5 days postinjury. *Differences between groups at specific time points identified by Bonferroni post hoc analysis after 2-way ANOVA (D–G, I). A–I: White bars represent WT, and black bars represent Ins2WT/C96Y. (A high-quality digital representation of this figure is available in the online issue.)

