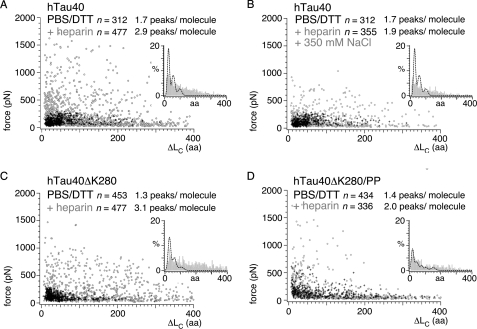
FIGURE 4.
Heparin-induced interactions in hTau40, hTau40ΔK280, and hTau40ΔK280/PP. Scatter plots of rupture forces detected upon stretching hTau40 (A), hTau40ΔK280 (C), and hTau40ΔK280/PP (D) in PBS containing 5 mm DTT in the absence (black crosses in A and B, n = 312; C, n = 453; and D, n = 434; pulling velocity 875 nm/s) and presence (open gray circles in A, n = 477; C, n = 244; and D, n = 336; pulling velocity 1000 nm/s) of 0.33 mm heparin. Insets show the distributions of ΔLC in the presence (gray bars) of heparin. For comparison, the fits to the ΔLC distributions in the absence of heparin (black dashed lines) are shown. B, scatter plot of force peaks detected when stretching hTau40 in the presence of 0.33 mm heparin and ∼500 mm electrolyte concentrations (PBS + 5 mm DTT + 350 mm NaCl + 0.33 mm heparin; open gray circles (B, n = 355). Heparin binding induced a large number of high force interactions (300–1500 pN) over the full range of contour lengths in hTau40 (A) and hTau40ΔK280 (C). The ensemble of interactions in hTau40ΔK280/PP (D) showed only minor changes. Addition of heparin at ∼500 mm electrolyte reversed most of the heparin-induced interactions in B. n, gives the number of analyzed F-D curves.

