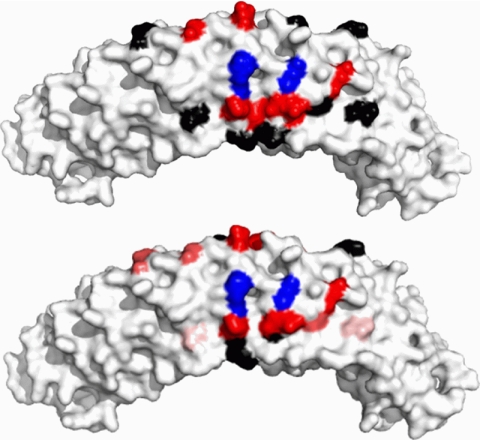
FIGURE 7.
Changes in spin label side chain mobility (upper panel) and solvent accessibility as assessed by collision frequency with NiEDDA (lower panel) mapped onto the x-ray crystal structure of AnkD34. The red residues in the top panel showed a decrease in side chain mobility upon complex formation, the black residues showed no change, and the blue residues showed significantly impaired complex formation when the wt residue was changed to cysteine and spin-labeled with MTSSL. The same color scheme is used for the NiEDDA accessibility data in the lower panel for the black and blue residues, whereas the residues that showed changes in accessibility were displayed with three different colors based on their ΔΠ (Πcomplex-ΠAnkD34) values (red, ΔΠ < −14.0; hot pink, −14.0 ≤ ΔΠ < −5.0; pale pink, −5.0 ≤ ΔΠ < −2.0).

