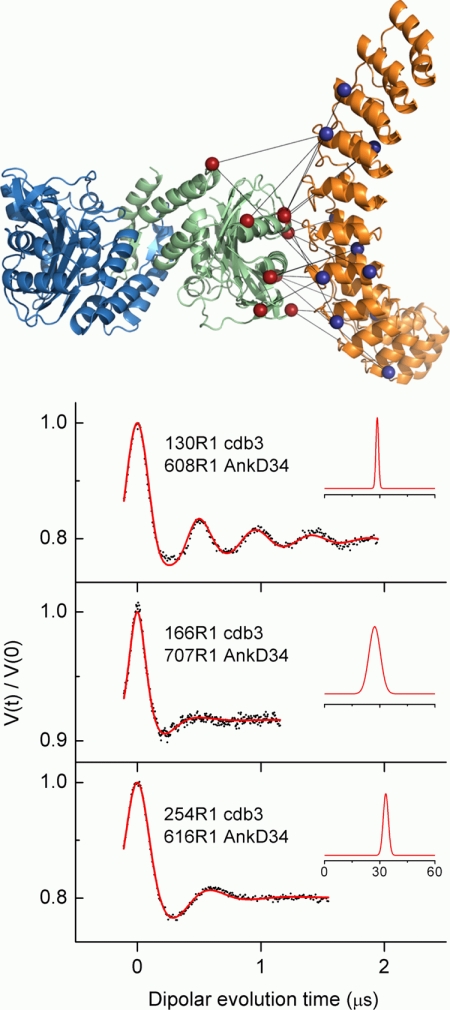
FIGURE 8.
The 20 inter-protein distances between selected sites on cdb3 and on AnkD34 that were used to refine the structural model for the complex shown in Fig. 10. The distances measured by DEER are shown superimposed on a selected model for the complex in the upper panel. Representative DEER data (dots) and the fits to these data (solid red lines) from three of the label pairs are shown in the lower panel. In the lower panel, the insets show the average distances and distance distributions that were recovered from fitting the experimental data as described under “Experimental Procedures.” The data and analyses from the remaining 17 pairs are shown in supplemental Fig. S4, and the data from all pairs are summarized in Table 3.

