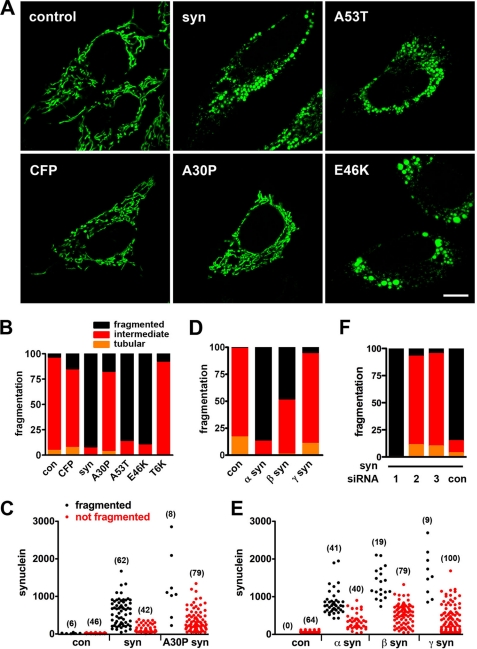
FIGURE 1.
Synuclein produces mitochondrial fragmentation in HeLa cells. A and B, HeLa cells were cotransfected with cDNAs encoding azurite (to identify transfected cells), mitoGFP (to identify mitochondria), and either empty vector control, CFP, wild type α-synuclein (syn), A30P, A53T, or E46K α-synuclein. 48 h after transfection, cells were selected on the basis of azurite fluorescence and imaged live; the images were randomized, and mitochondrial morphology was classified as fragmented, tubular, or intermediate blind to the genotype of transfection. Scale bar indicates 10 μm. The bar graph (B) shows the percentage of cells in each group. Wild type, A53T, and E46K α-synuclein produce mitochondrial fragmentation not observed in control (con), CFP, A30P, and T6K (replacement of Thr-22, Thr-33, Thr-44, Thr-59, Thr-81, and Thr-92 with lysines) synuclein, p < 0.0001 by χ2 analysis. n = 33–41 cells per group from two independent transfections. C, cells transfected as above were also fixed and immunostained for α-synuclein, and those with a range of synuclein levels (selected blind to mitochondrial morphology) were imaged and classified in terms of mitochondrial morphology. The number of cells in each group is indicated in parentheses. D and E, effects of α-, β-, and γ-synuclein on mitochondrial morphology were assessed the same way in live HeLa cells and in fixed cells immunostained for synuclein (E). α- and β-synuclein produce mitochondrial fragmentation (p < 0.0001), whereas γ-synuclein does not (D). n = 39–50 cells per group from three independent transfections. F, cells were cotransfected with synuclein and either siRNA to human synuclein (Silencer Select s13204 (1), s13205 (2), and s13206 (3)) or control siRNA (Silencer Select negative control 1 (con)). siRNA2 and -3 (but not siRNA1 or control siRNA) effectively reduce synuclein expression (supplemental Fig. S3) and block mitochondrial fragmentation (n = 18–27 cells per group from two independent transfections, p < 0.0001).

