FIGURE 2.
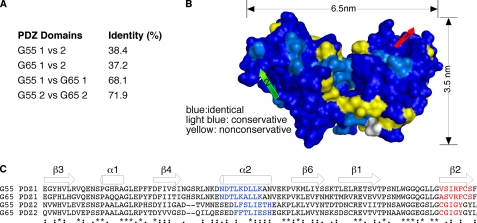
Comparison of GRASP55 and GRASP65 PDZ domains. A, the percentage of identical residues between individual PDZ domains of G55 and G65 is shown. B, G65 modeled from the G55 structure showing residues that are identical (dark blue), conserved (light blue), and non-conserved (yellow) indicates highest similarity within the binding grooves of PDZ1 (red arrow) and PDZ2 (green arrow). C, sequence alignment of the four individual PDZ domains of G55 and G65 indicates highest similarity within ligand-binding domains formed by the second α-helix (shown in blue) and second β-strand (shown in red). Asterisks indicate sequence identity across domains, two dots indicate highly conservative changes, one dot denotes moderately conservative changes, and zero dots indicate little or no similarity between residues.

