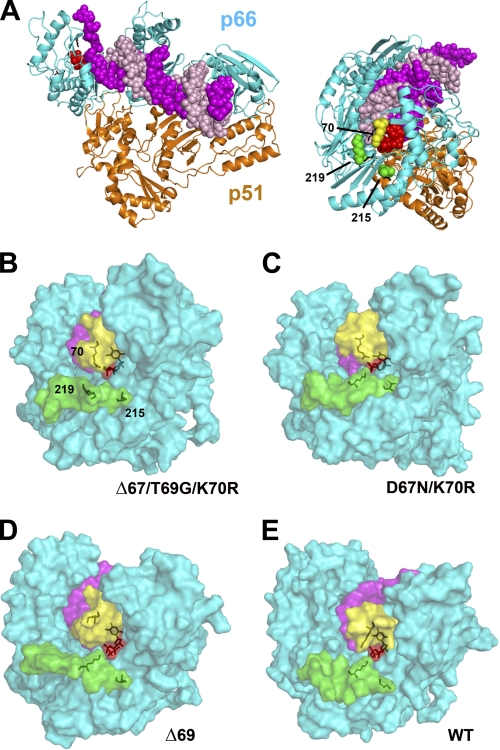
FIGURE 4.
Comparison of the structural models of mutant and WT HIV-1 RTs, complexed with dsDNA and an incoming dNTP. A, crystal structure of the ternary complex of HIV-1 RT (ribbon diagrams), dsDNA (sphere model showing the template in magenta and the primer in light pink) and dTTP (red spheres). A side view of the complex showing the dNTP binding site and the location of Lys-70, Thr-215, and Lys-219 is shown on the right. B–E, views of the surface of the molecular models of mutant RTs Δ67/T69G/K70R (B), D67N/K70R (C), and Δ69 (D) and the WT enzyme (E), showing the location of β3-β4 hairpin loop residues 64–72 (yellow) and residues 215–227 (green). The dsDNA and the incoming dNTP (partially hidden by the color structures) are shown in magenta and red, respectively. Stick representations are use to indicate the location of the incoming dNTP and the side chains at positions 70, 215, and 219 (numbering as in the WT HIV-1 RT). All RTs (66-kDa subunits) were previously aligned and superimposed using PyMol, and are presented in the same orientation as the structure shown in panel A (right).

