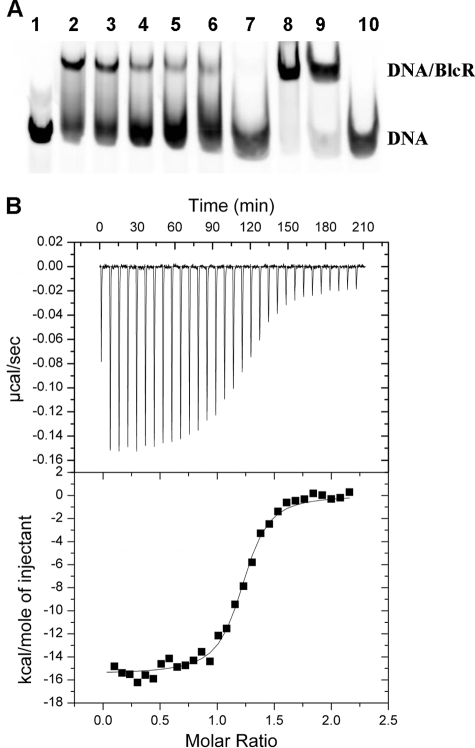
FIGURE 5.
Effect of SSA on DNA binding activity of BlcR and BlcRF147A. A, EMSA studies. Lane 1, 214-bp DNA. Lanes 2–7, SSA effect on BlcR-DNA; SSA concentrations were as follows: 0, 0.01, 0.1, 1, 10, and 100 mm, respectively. Lanes 8 and 9, SSA effect on BlcRF147A-DNA; SSA concentrations were 0 and 100 mm, respectively. Lane 10, DNA with 100 mm SSA. The DNA concentration remained 27.2 nm. B, ITC studies of titrating BlcRF147A into the 51-bp DNA in the presence of excess SSA (BlcR monomer/SSA = 1:6). A and B are as described in the legend to Fig. 3, C and D.

