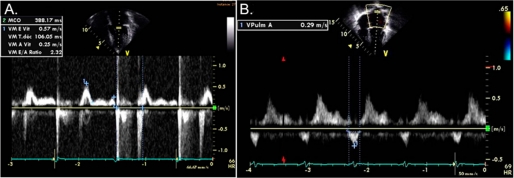
FIGURE 1.
Doppler imaging. A, shown is a pulsed wave Doppler image of left ventricular inflow at the level of the mitral valve, demonstrating restrictive physiology. B, shown is a pulsed wave Doppler image of pulmonary venous inflow into the left atrium. Note clearly positive s and d waves followed by a negative a wave.

