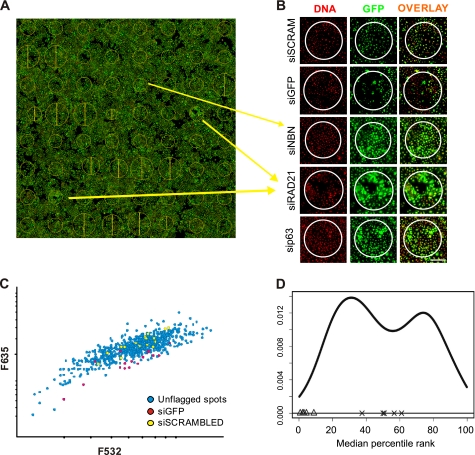
FIGURE 1.
siRNA microarray screen. A, scan of a transfected arrays is presented, with cellular GFP appearing in green, and the DNA content stained in red. The yellow circles represent areas where specific siRNA was printed and where reverse transfection of cells occurred. Position and size of the circles were automatically calculated by the Genepix software that was used to analyze the data B, close-up view of the image presented in A. The green/red channels as well as the overlay are presented for the two controls and new putative ID2 regulators. A decrease in GFP can be observed with the GFP-targeted siRNA compared with cells transfected with the scrambled siRNA. By contrast, NBN- (NBS1), p63-, and RAD21-targeting siRNA induced up-regulation of ID2-dependent GFP expression. Scale bar indicates 200 μm. C, scatter plot displaying distribution of F635 and F532 signal intensities for each spot in a given siRNA microarrays showed a linear increase of the GFP signal proportional to the number of cells estimated from DNA content. siGFP-targeted siRNA (red) and scrambled siRNA (yellow) are also indicated on the plot. D, distribution of the median of rankings among all replicated siRNA microarrays. The graph depicts the ranking-based non-parametric approach output for a batch of 4 replicate siRNA microarrays. The GFP-targeted siRNA spots (Δ) are consistently classified at the lower end of the distribution while scrambled siRNA (×) transfected cells are consistently ranked in the middle of the distribution, validating the strategy used for the analysis.

