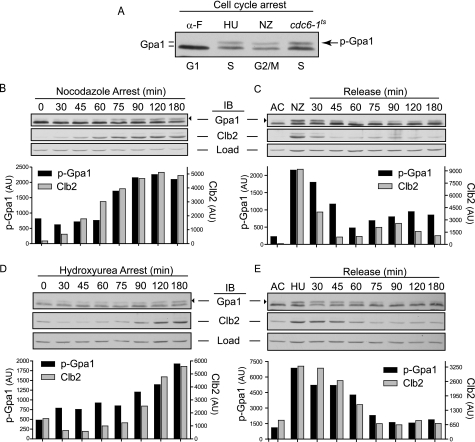
FIGURE 4.
Gpa1 phosphorylation is cell cycle-dependent. Cells treated for 2.5 h with α-factor pheromone (α-F, arrests cells in G1 phase), hydroxyurea (HU, arrests cells in S phase) or nocodazole (NZ, arrests cells in G2/M phase) followed by release into fresh medium where indicated. Shown are aliquots taken at the indicated time points followed by immunoblotting. The abundance of phosphorylated Gpa1 (black arrowhead) and Clb2 were quantified by densitometry from the immunoblot shown above. AU, arbitrary units; AC, asynchronous cells; Load, G6PDH loading control. A, direct comparison of Gpa1 from arrested cells. Cells were also arrested in late G1/early S phase by temperature shift of cdc6-1 cells. B, nocodazole arrest. C, nocodazole release. D, hydroxyurea arrest. E, hydroxyurea release.

