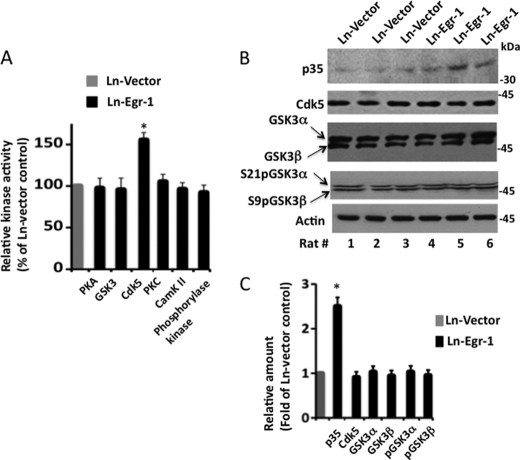
FIGURE 3.
Identification of kinase activated in rat hippocampus injected with Ln-Egr-1. Each rat brain hippocampus injected with Ln-Egr-1 or Ln-vector was individually homogenized, and each homogenate was subjected to a kinase assay using a peptide substrate that was directed to the indicated kinases or analyzed by Western blot analysis using the indicated antibodies. A, relative kinase activity. The specific activity of a kinase in each sample was determined and normalized against the specific activity value of that kinase in the Ln-vector-injected hippocampus. Values are the mean ± S.E. from three hippocampal extracts in each group. B, Western blots. C, relative amounts. The relative amounts of various proteins were determined as in Fig. 2 from the Western blot representing B. To calculate the relative phosphorylation of GSK3α or GSK3β, the average band intensity value of phosphorylated GSK3α or GSK3β was normalized against the respective total GSK3α or GSK3β band intensity value. Values are the mean ± S.E. from three hippocampal extracts in each group. *, p > 0.05 (t test). pGSK3, phosphorylated GSK3; CamK II, Ca2+/calmodulin-dependent protein kinase II.

