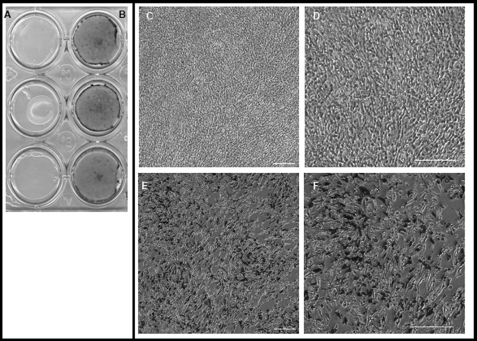
FIGURE 4.
Visualization of the mineralization process in NIH 3T3-PP cells. Panel A shows a von Kossa stain of control NIH 3T3 cells (day 10); negligible staining indicates a lack of mineralization. Panel B shows a positive von Kossa stain at day 10 of transfected NIH 3T3-PP cells indicating the presence of mineralization. Panels C–F, cells stained at day 10 with von Kossa and counterstained with fuchsin red. Panels C and D, non-transfected cells (control) shown at ×10 and 20 magnification, respectively (scale bar = 200 μm). Panels E and F show transfected cells with multiple mineral deposit foci at ×10 and 20 magnification, respectively.

