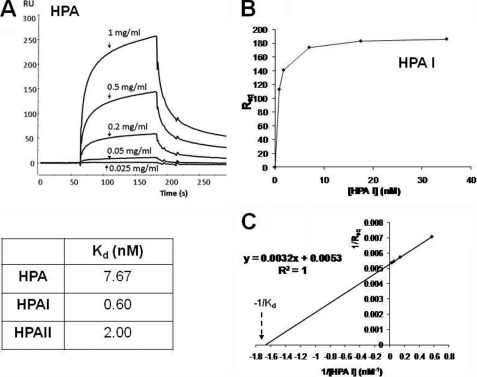
FIGURE 5.
SPR analysis of binding of native HPA, rHPAI-Trx, and rHPAII-Trx to GalNAc-BSA immobilized on a CM5 Biosensor chip surface using the BIAcore 2000 system. Approximately 3000 response units of ligand was immobilized on the sensor chip surface while the lectin concentration varied between 0 and 35 nm (as indicated). The flow rate was maintained at 20 μl/min, the injection time was typically 120 s followed by 3-min dissociation. A shows the binding of native HPA to immobilized GalNAc. B shows a plot of response units at equilibrium versus lectin concentration for the binding of HPAII to GalNAc, data which can, in turn, be used to determine the Kd value (C).

