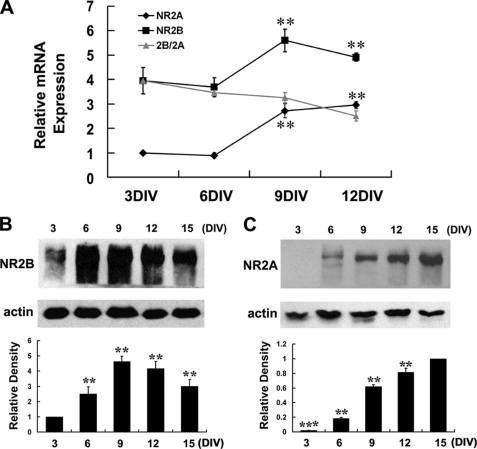
FIGURE 3.
Expression of NR2A and NR2B increases strikingly in cultured hippocampal neurons during maturation. A, real time RT-PCR analysis of NR2A and NR2B expression. Relative mRNA abundances were normalized to the NR2A mRNA of 3DIV neurons. **, p < 0.01 versus 3DIV. Note that the overall abundance of NR2B is much higher than NR2A during the whole examined period, but the relative ratio of 2B/2A kept decreasing. B and C, Western blot analysis of NR2B and NR2A protein expression. Scanning densitometry was quantified and normalized to 3DIV (B) or 15DIV (C) on the same Western blots. **, p < 0.01 versus 3DIV (B); **, p < 0.01; ***, p < 0.001, versus 15DIV (C). Representative blots were showed from three independent experiments.

