FIGURE 9.
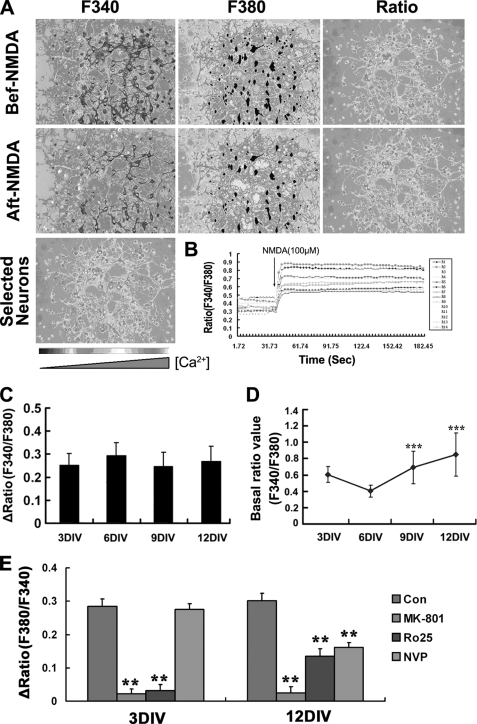
NMDA triggers similar calcium influx both in mature and immature neurons, whereas the basal [Ca2+]i level elevates with development. A, representative experiment that measured the NMDA induced calcium influx in 6DIV neurons by the fura-2 method. Pseudo-colored images were captured under the indicated excitation waves. Image showed the 14 neurons that has been selected and analyzed. B, response curves of ratio (F340/380) value against time of 14 selected neurons in 6DIV culture. Note that the ratio value increased immediately after addition of NMDA and was kept at the plateau levels within the experimental time range of 200 s. The ratio of fura-2 fluorescence was indicated with a gray scale bar from black (low [Ca2+]i) to white (high [Ca2+]i). C, amplitude of calcium influx in different developmentally staged neurons. Note that there were no obvious differences among them. D, basal level of intracellular free calcium increased with development. The basal ratio value of F340/F380 before NMDA stimulation was compared between neurons of different DIV. ***, p < 0.001 versus 6DIV. (328, 157, 139, and 75 total cells from 3, 6, 9, and 12 DIV points were analyzed, respectively.) E, effects of NMDARs antagonists on Ca2+ influx. At 3- or 12DIV, neurons were perfused with BSS containing MK-801 (0.3 μm), Ro-256981 (Ro25, 0.5 μm), NVP-AMM077 (NVP, 0.5 μm) or not for 2 min and then with the same BSS containing NMDA (100 μm) or not for 3–5 min. Results are from three independent experiments tracing about 120 total neurons for each data point. **, p < 0.01 versus control (Con). Note that NMDA-induced [Ca2+]i increase in 3DIV neurons is completely blocked by Ro-6981 (Ro25) but is not affected by NVP-AMM077 (NVP), whereas the increase in 12DIV neurons significantly and completely blocked but only partially blocked both NVP-AMM077 and Ro-256981. Bar, 50 μm.

