FIGURE 2.
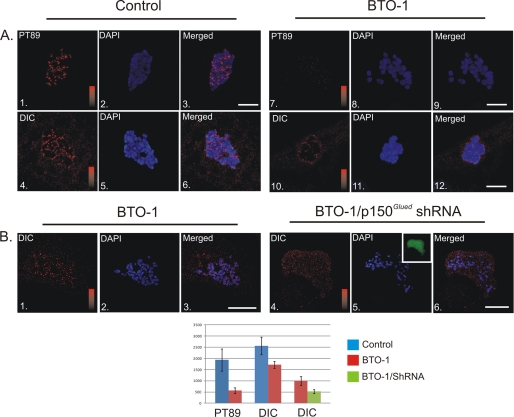
Plk1-dependent and Independent Populations of Dynein at Kinetochores. A, NRK2 cells treated with vehicle control (panels 1–6) or BTO-1 (panels 7–12) were stained for phosphorylated dynein (PT89) or total dynein (red) and chromatin (blue). Both PT89 dynein and total dynein were reduced significantly at kinetochores after Plk1 inhibition (p = 5.16 × 10⁻²⁰ for pT89, p = 5.86 × 10⁻¹⁰ for total dynein). However, some total dynein staining remained after BTO-1 treatment. Intensity scales = 0–2500 (panels 1 and 7) and 0–3000 for total dynein (panels 4 and 10). Scale bar = 5 μm. B, control NRK2 cells and NRK2 cells expressing shRNA plasmid against p150Glued were both treated with BTO-1 and stained for total dynein (red) and chromatin (blue). Although control cells retain some total dynein after BTO-1 treatment (panels 1–3), dynein levels are reduced (p = 2.26 × 10⁻⁶) to background in cells depleted of p150Glued and treated with BTO-1 (panels 4–6). Intensity scales = 0–1500 (panels 1 and 4). Scale bar = 5 μm.

