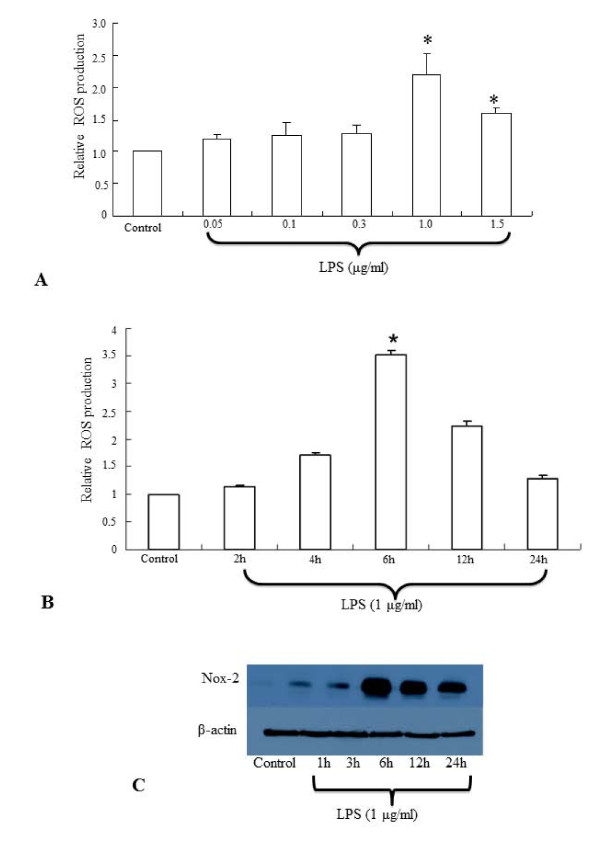
Figure 1.
A-C. Effect of LPS on the ROS production and Nox-2 protein expression in BV-2 microglial cells . Flow cytometry hitogram shows that ROS production is significantly increased in BV-2 microglial cells treated with LPS at the concentration of 1.0-1.5 μg/ml for 6 h (A). Time course analysis reveals that maximum ROS production occurs in BV-2 cells treated with LPS for 6 h (B). Western blot analysis shows that Nox-2 protein expression is increased maximally in BV-2 cells treated with LPS at 1 μg/ml for 6 h (C). The data represent the mean ± SD (n = 3); * p < 0.05

