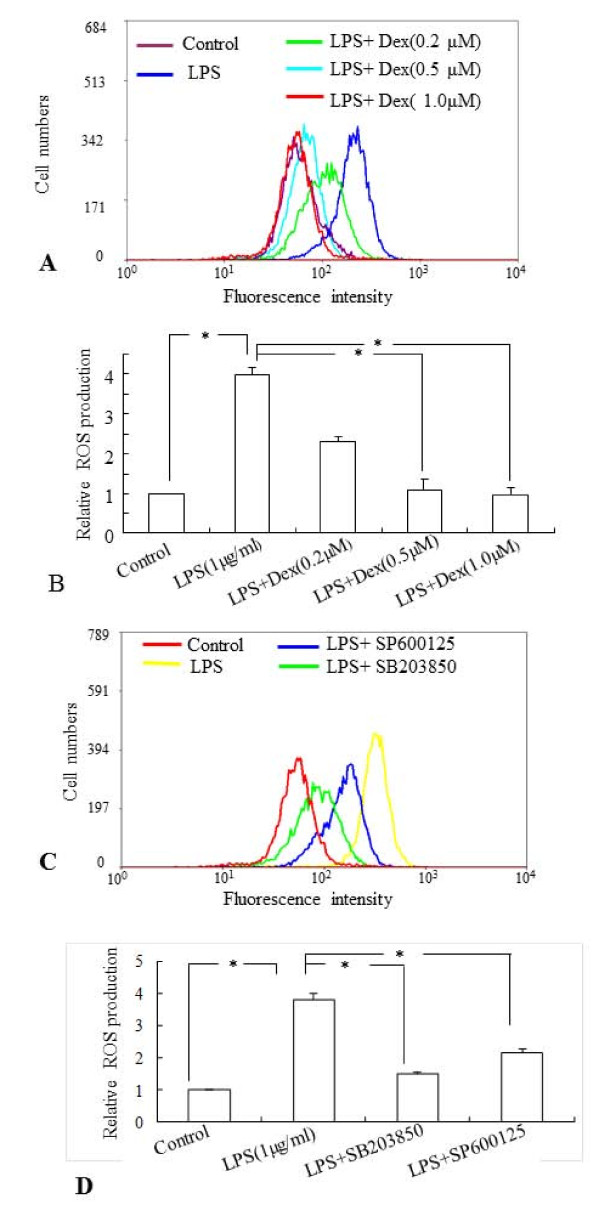
Figure 3.
A-D The flow cytometric and quantitative analyses showing the suppressive effects of Dex and inhibitors of MAPKs on ROS production in BV-2 cells. LPS induced ROS generation significantly in BV2 cells compared to control and preincubation of Dex suppressed the induction of ROS production in a dose-dependent manner (0.2, 0.5 and 1.0 μM) (A, B). Similarly, inhibitors of p38 (SB203580) and JNK (SP600125) suppressed the ROS generation in LPS stimulated BV-2 cells (C, D).Quantitative analysis of ROS production in BV-2 cells subjected to different treatments is shown in B and D. Panels A and C represent the results of flow cytometric analysis of DCF fluorescence intensity from one sample of each group obtained from three independent experiments performed. The data represent the mean ± SD (n = 3); * p < 0.05.

