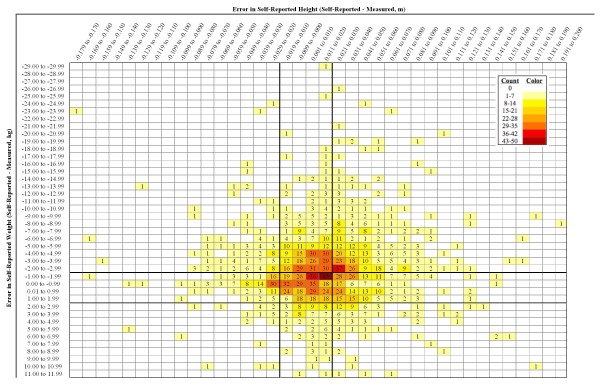
Figure 2.
Map of the frequencies of error in height and weight. Measured height (m) and weight (kg) were subtracted from their corresponding self-reported values to yield Error in Self-Reported Height (columns) and Error in Self-Reported Weight (rows). In both cases, negative values indicate that the self-reported value was less than the measured value. The degree of error was categorized in 1.0 cm or 1.0 kg intervals, and the frequency of error within each interval was determined. Solid lines indicate the cut-off values for accurately reported height (-0.02 m to +0.02 m) and accurately reported weight (-2.0 kg to +2.0 kg) to take into account technical errors of measurement and short-term fluctuations in weight and height. These lines form nine regions that correspond to the nine error pattern categories listed in Table 1. Counts are shown in each cell. Blank cells represent a count of zero, and each progressively darker shade represents the next seven-count level.

