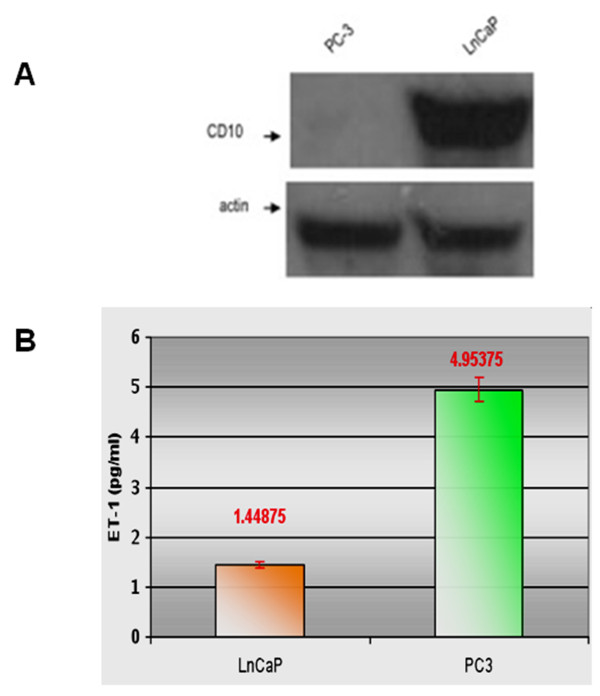
Figure 2.
NEP cellular expression and ET-1 secretion in PC cell lines. (A) Total cellular NEP levels in PC-3 (left) and LnCaP cells (right). (B) ET-1 ELISA detection in culture supernatants of LnCaP (left; 1.448, SD: 0.06) and PC-3 cells (right; 4.953, SD: 0.49). All measurements in octuplicate (p < 0.001).

