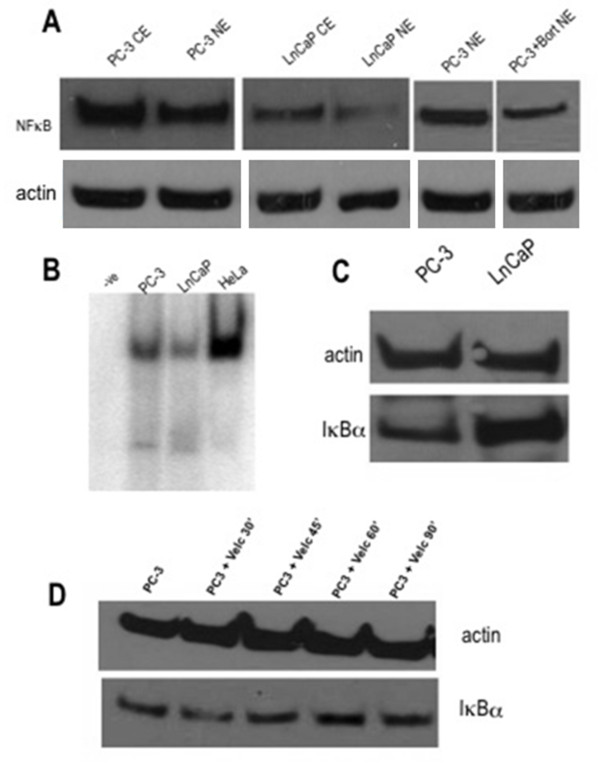
Figure 4.
NFκB activation in PC cell lines. (A) Nuclear and cytoplasmic NFκB levels in PC-3 (left) and LnCaP cells (middle). Right: Nuclear extracts of PC-3 cells at baseline and following bortezomib incubation (1 μM for 60 min). (B) NFκB EMSA. Lane 1: negative control; Lane 2: PC-3 cells; Lane 3: LnCaP cells; Lane 4: HeLa cells (6 hrs post-infection). (C) Total cellular IκBα levels in PC-3 (left) and LnCaP cells (right). (D) Total cellular IκBα levels in PC-3 cells following serial incubations with bortezomib 1 μM.

