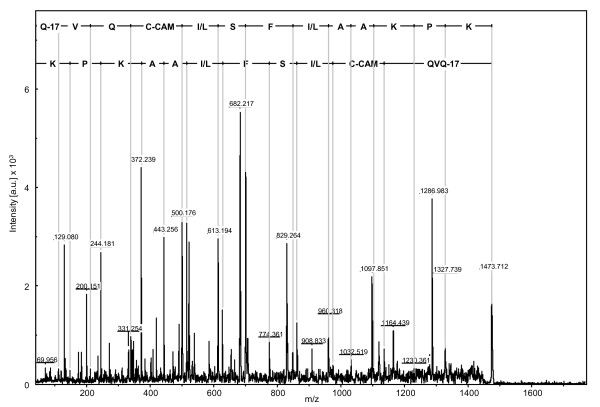
Figure 10.
MS/MS mass spectra of the ion M+H 1472.973 (peptide 4). This ion was isolated from RBCS1 spot 1 of clone 14 of C. canephora under NI conditions. The amino acid sequence of peptide 4 is indicated in the upper part of the graph. The x-axis represents the mass-to-charge (m/z) ratio, and the y-axis represents the intensity of peaks expressed in arbitrary units (a.u.).

