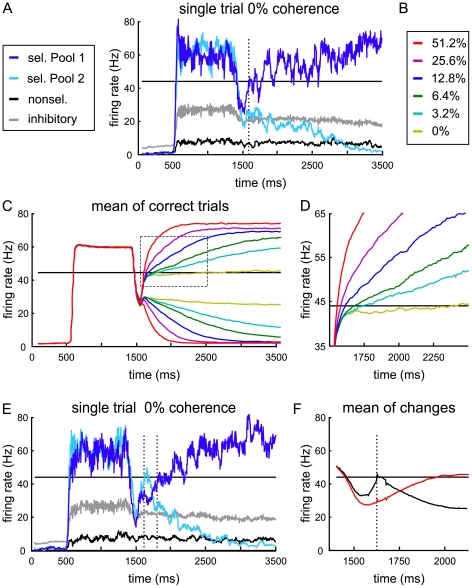
Figure 4. Model prediction of LIP firing rate.
(A, E) Simulated temporal evolution of population-averaged firing rates for single trials. The dotted lines mark times of threshold crossings. The black line at 44 Hz indicates the threshold. (A) Example for a regular trial without change. As observed in recent neurophysiological studies of LIP [6], [8], [15], the firing rates of the selective populations show a high increase during target presentation (from 500 to 1,300 ms), followed by a dip after the onset of the motion stimulus. The activities of both selective populations ramp up with the application of the motion input (beginning at 1,500 ms), while the transients compete for the higher attractor state. (C, D) Mean of correct trials from 1,000 network simulations, shown for all motion coherences (Color code according to B). For each motion strength the firing rates were averaged according to the “winners” and “losers” of the first decision. After an initial joint build-up, the slope of the ramping activity is flatter with smaller motion coherence. (D) Blow up of dotted rectangle from (C). (E) In some cases the initially winning population (first threshold crossing) is overtaken by the other transient, which is counted as a “change of mind” trial. (F) Mean of all trials with changes (correct and error trials, all motion coherences) aligned to the first threshold crossing (dotted vertical line). Black: initially winning selective pool, red: finally winning selective pool.

