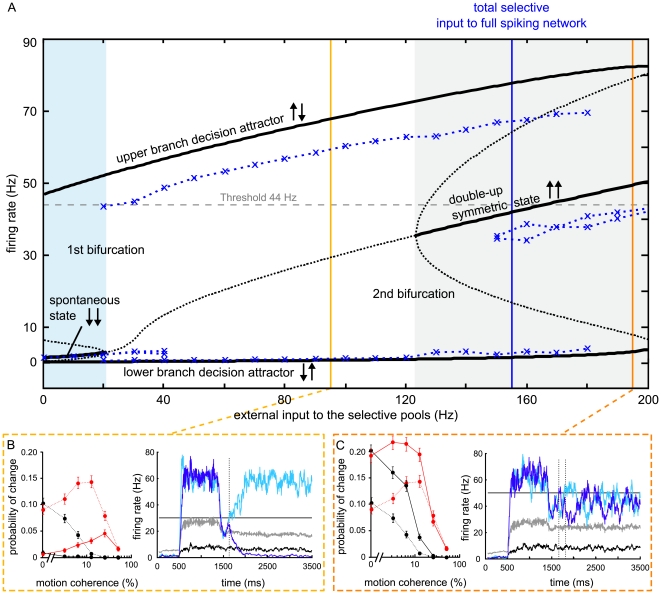
Figure 6. Proximity to bifurcation is important to obtain changes of mind.
(A) Mean-field analysis of attractor network. For the parameters used in the spiking model simulation, the stable (solid black line) and unstable (dotted black line) fixed points were calculated with the mean-field approximation over a range of external inputs, applied symmetrically to both selective pools (0% coherence) from 0 to 200 Hz in steps of 1 Hz, in addition to the background input of 2.4 kHz to all neurons. There are three qualitatively different regions to distinguish, separated by bifurcations. In the blue shaded region up to about 20 Hz the spontaneous state (both pools firing at low rates, ↓↓) and the decision state (one pool firing at high, the other at low rates ↓↑) are simultaneously stable. The spontaneous state becomes unstable for higher inputs (white region) until at about 125 Hz a symmetrical state with both pools firing at elevated rates appears (grey shaded area, ↑↑). The blue crosses show the fixed points of the spiking-neuron model for several discrete selective input amplitudes (see methods). The second bifurcation there is shifted by about 25 Hz to higher selective inputs (to the right) for the spiking simulations with respect to the mean-field approximation. The input used in the spiking simulation (blue vertical line, 155 Hz) lies close to the real second bifurcation point. Also, the double-up symmetric state lies below the decision-threshold (44 Hz, horizontal dashed line) while the upper branch of the decision attractor (“winner”) lies above. (B, C) Changes of mind and single trial examples for lower (B) and higher (C) network inputs (yellow and orange lines in (A)). All parameters and the motion input were the same as in the other simulations, only the target input after motion onset was set to 25 Hz for (B) and to 125 Hz for (C). Dashed lines in the left panels give changes of mind from Fig. 2A for comparison. Red: changes to correct, black: changes to wrong choice. With less selective inputs (B), fewer changes of mind are obtained, although the threshold was adapted to fit the reaction times and performance (Fig. S2). With higher selective inputs (C) too many changes are predicted for low motion coherences and the selective transients no longer separate, but stay in the symmetric state. Color of single trial firing rates are the same as in Fig. 3. Error bars denote SEM.

