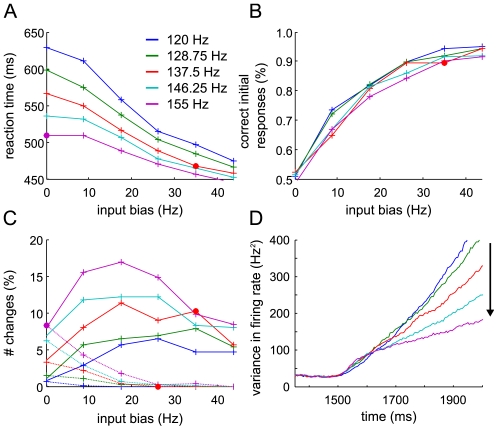
Figure 7. Model predictions for different levels of common selective inputs.
The baseline external input, common to both selective populations, as well as the input bias to one of the selective populations were varied in steps of 8.75 Hz. Different colors indicate the amount of common inputs, starting from 120 Hz to 155 Hz (standard input to model the experimental changes of mind). Mean reaction times (A), performance (B) and changes to correct (C, solid lines) and wrong (C, dashed line) alternative are plotted against the input bias between the selective populations. The decision threshold was fixed at the standard decision criteria (44 Hz, 10 Hz difference). 1,000 trials were simulated for each data point. The pink and red dots correspond (approximately) to the standard input parameters used above at 0% and 25.6% (here actually 25%) motion coherence. Increasing the baseline inputs leads to faster reaction times, lower performance and overall more changes. (D) Evolution of the mean firing rate variance across trials for one selective population, starting from shortly before motion input onset (1,500 ms). The firing rate variances increase quite linearly with time. With increasing baseline inputs to both selective populations, the variance across trials becomes lower from ∼150 ms after motion onset.

