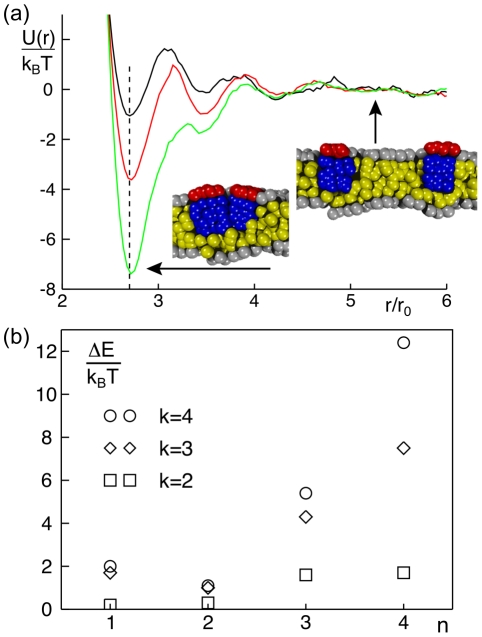
Figure 5. Dimerization of peripheral membrane proteins.
(a) Representative potentials of mean force,  , of two PMPs (
 ) residing in the same leaflet. The minimum of
  is located at the anticipated distance where proteins touch each other (dashed line). The binding energy
  increases with growing hydrophobic length of the protein (
 , shown in black, red and green, respectively). Representative snapshots indicate the protein configuration in the bound and unbound state. Hydrophilic and hydrophobic groups are shown in red/grey and blue/yellow, respectively. (b) The binding energy
  increases with the length of the hydrophobic moiety,
  . While one observes for small radii (
 ) only a very small increase in the dimerization energy, a strong increase is seen for larger radii (
 ).
).

