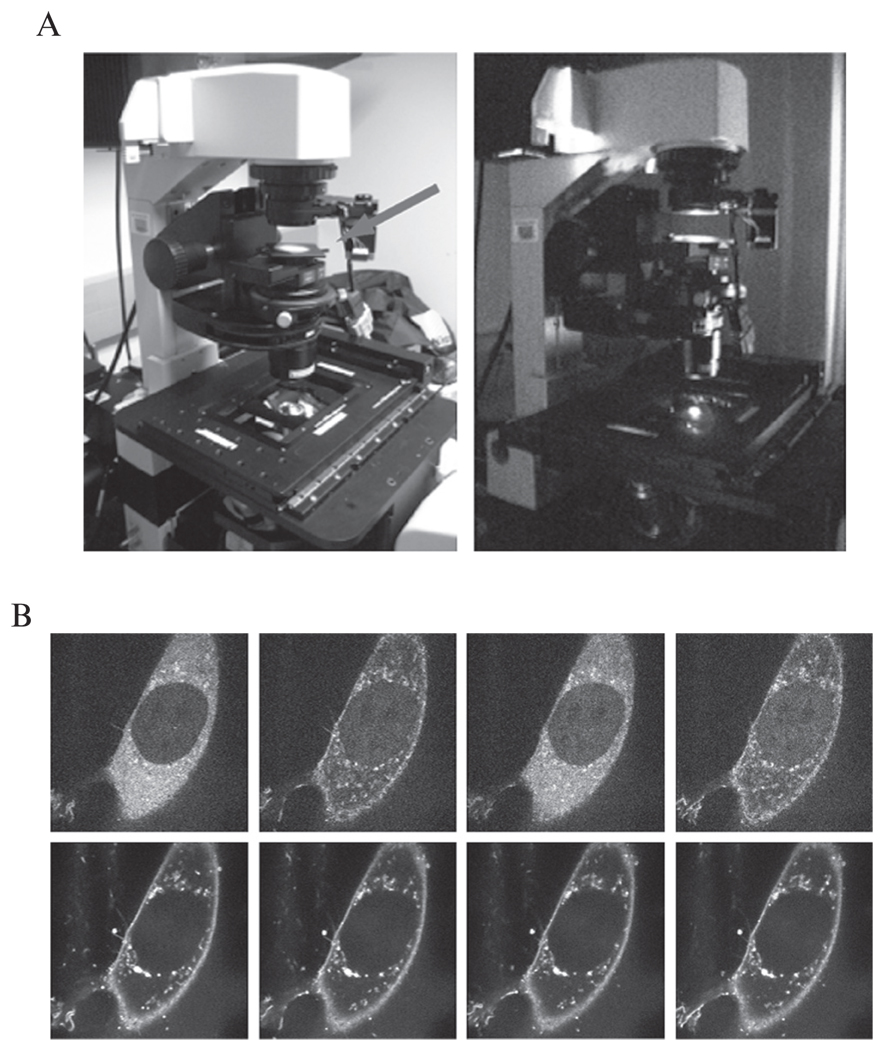
Figure 17.4.
Confocal microscopy to image Phy–PIF translocation. (A) A 750 nm filter can be placed in the brightfield light path to elicit Phy–PIF dissociation. With this filter in place, illuminating with brightfield light leads to Phy–PIF dissociation. Simply removing the filter provides enough activating light to induce Phy–PIF translocation. Alternatively, RFP excitation light (650 nm) can be used to induce association. (B) A montage of confocal images of a NIH-3T3 cell showing PIF–YFP translocation in response to light. Cells were prepared harboring the genetic constructs described in Section 3. The upper panel shows PIF–YFP fluorescence after sequential 30 s exposures of activating (brightfield) and inactivating (750 nm filtered) light. Phy-mCherry levels in corresponding timepoints are shown in the lower panels.

