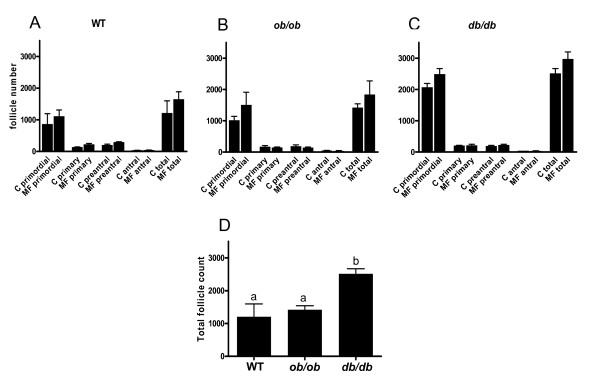
Figure 4.
Ovarian follicular counts (non atretic) following in vivo metformin exposure. Horizontal axis indicates follicle stage. Follicle counts were performed in mice (N = 3) who underwent 7 weeks of oral metformin treatment or no treatment (control) (A, B, C). C = control, MF = metformin. All counts of this figure included 3 replicates with N = 1 mouse. Error bars represent SEM. Follicular counts (of any stage) did not change (relative to control group) following metformin treatment. Overall, db/db mice demonstrated a significantly greater total follicular endowment (sum of all non atretic follicle stages) than WT and ob/ob mice (D). Different designated letters among genotypes in D indicates statistical difference with p = 0.01 (ANOVA).

