
Figure 7.
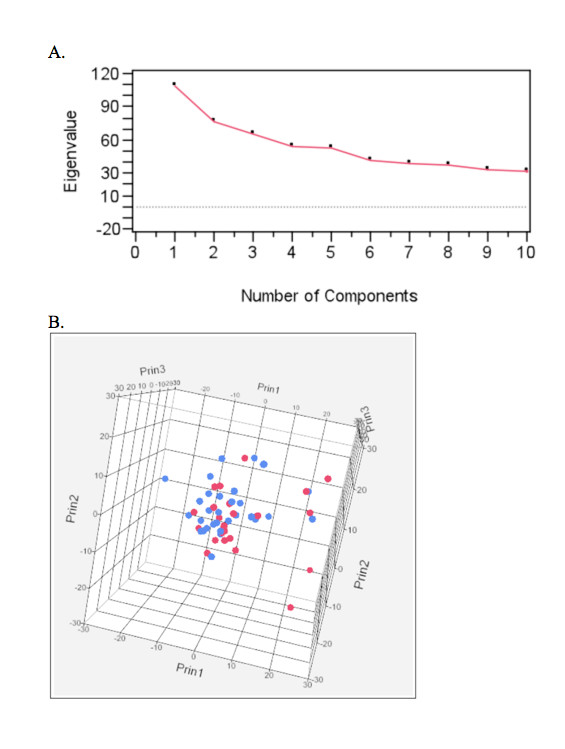
Principal Component Analysis (PCA) to identify potential population substructure between French and American BMD cases of HS. A). Scree plots of the eigen values first 10 components. B). Three dimensional plot of the first three components. American BMD patients are indicated in red while French BMD patients are indicated in blue.