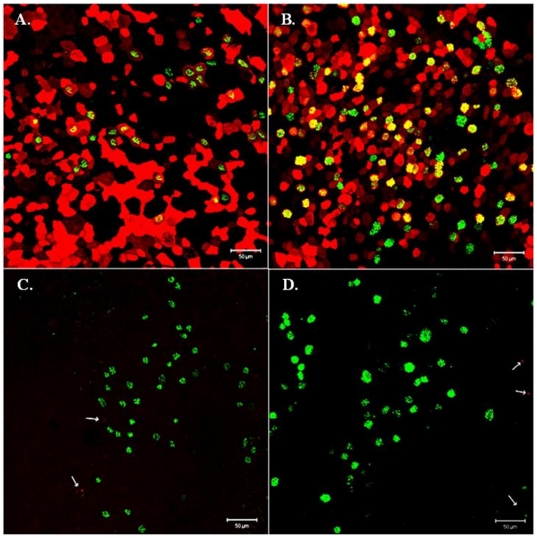
Figure 2. Ciliated and goblet cells express mainly α2,6 sialic acid linkages.
NHBE cells were stained for α2,6 (A, B) or α2,3 (C, D) linked sias shown in red, and β-tubulin (A, C) or MUC5AC (B, D) shown in green. Cells expressing a2,3 sias are indicated with arrows. Results shown are representative of two independent experiments.

