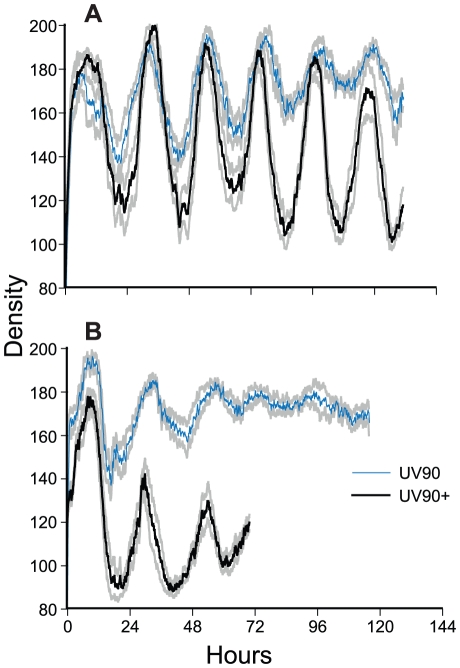
Figure 4. Densitometry of chol+; frq+ progeny.
Race tube cultures of progeny from the cross of csp-1; rasbd; UV90 to Mauriceville were analyzed by densitometry. Six csp-1 progeny from each class were randomly chosen for analysis. Densitometry traces were averaged for each class and plotted ± one S.E.M. A. rasbd progeny. B. ras+ progeny. Thick black lines: UV90+ progeny. Thin blue lines: UV90 progeny. Gray lines: ± one S.E.M. All cultures were grown without choline. Density is in arbitrary units. Time is in hours after transfer from LL to DD.

