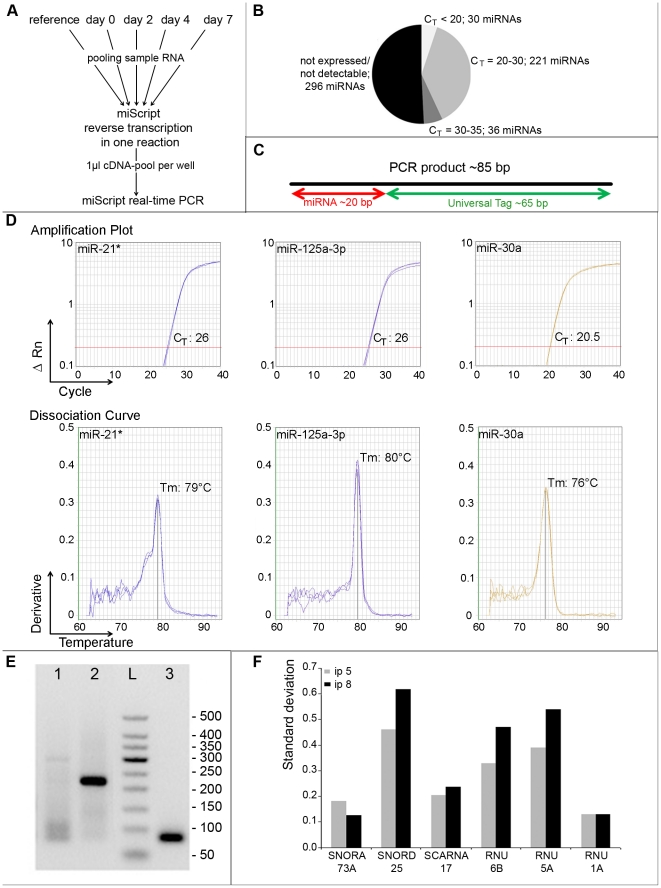
Figure 2. Real-time PCR based profiling of miRNAs being differentially regulated during the course of MSC differentiation to adipocytes.
A: RT-PCR based pooling strategy to identify all miRNAs being expressed in any of the samples taken during the differentiation time-course. B: Summary of the expression levels of 583 miRNAs analyzed with the pooling strategy. C: Schematic overview of a typical miRNA PCR amplicon produced by SYBR Green based miScript PCR assays. PCR products are typically around 85 bp long and of these 20 bp resemble the variable miRNA sequence while the remaining 60 bases contain the universal PCR primer binding site introduced during reverse transcription. D–E: Melting curve analysis (D) in combination with agarose gel electrophoresis (E), Lane 1: miR-21*, lane 2: miR-125a-3p, lane 3: miR-30a PCR-products, “L”: GelPilot 50 bp Ladder revealed the specificity of miRNA PCR products. F: Identification of the most suitable housekeeping gene for the normalization of the miRNA expression data. For this purpose the expression of six small RNAs was analyzed at all time points and in both cell passages. To identify the small RNA showing the lowest variation over the whole sample set the mean values and standard deviations of all time points were calculated for every gene and cell passage. The table shows the standard deviations of these means.

