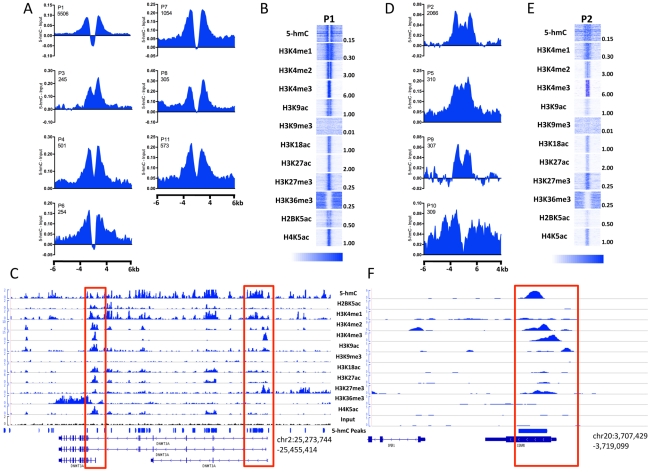
Figure 5. 5-hmC marks distinct subtypes of promoters in human H1 ES cells.
A. Distribution of 5-hmC at P1-type, bimodal promoters. 5-hmC reads were summed in 100-bp windows and the immediate 4-kb region, as well as 4 kb upstream and downstream of the immediate 4-kb region, centered on each H1 hES cell promoter type defined on the basis of their chromatin signature [15], [27]. Counts were normalized to the total number of aligned reads in millions and input reads counted and normalized in the same manner were subtracted. B. Heatmap representations of 5-hmC and 11 histone modifications at P1-type bimodal promoters. Heatmap scale is indicated below, and maximum values per mark are indicated to the right of each representative heatmap. C. Genomic view of the DNMT3A locus with read distributions for 5-hmC and 11 histone modifications exemplifying the bimodal distributions observed. Highlighted in red are the promoter regions. D. Distribution of 5-hmC at P2-type promoters. 5-hmC reads were summed in 100-bp windows in the immediate 4-kb region, as well as 4 kb upstream and downstream of the immediate 4-kb region, centered on each H1 hES cell promoter type. Counts were normalized to the total number of aligned reads in millions and input reads counted and normalized in the same manner were subtracted. E. Heatmap representations of 5-hmC and 11 histone modifications at P2-type bimodal promoters. Heatmap scale is indicated below, and maximum values per mark are indicated to the right of each representative heatmap. F. Genomic view of the CENPB locus with read distributions for 5-hmC and 11 histone modifications exemplifying P2-type promoters. Highlighted in red is the promoter region.

