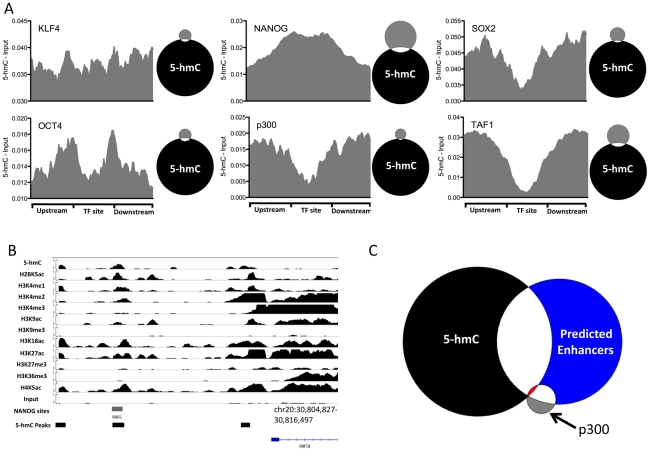
Figure 7. 5-hmC at pluripotency-associated core transcription factor binding sites in human H1 ES cells.
A. 5-hmC read distributions at KLF4 (n = 3,795), OCT4 (n = 3,890), SOX2 (n = 5,684), NANOG (n = 25,076), p300 (n = 3,094), and TAF1 (n = 12,363) binding sites in H1 hES cells. 5-hmC reads were counted in 40 equally portions within, upstream, and downstream of each binding site and values were normalized to the total number of aligned reads. Input reads counted and normalized in the same manner were then subtracted. Shown to the right of each plot is a scaled Venn diagram of the number of transcription factor binding sites (in gray) directly overlapping 5-hmC enriched regions (in black, 82,221) for reference. Overlaps are defined as ≥1 bp. B. Genomic view of 5-hmC coverage and 11 histone modifications at the DNMT3B locus, showing overlap of a 5-hmC peak, NANOG site, and the associated histone modifications. C. Scaled Venn diagram depicting the overlap between 5-hmC enriched regions (black, 82,221), p300 binding sites (gray, 3,094), and predicted enhancers reported in [15] (blue, 58,023). Shown in red is the overlap of all three (25 regions). Overlaps are defined as ≥1 bp.

