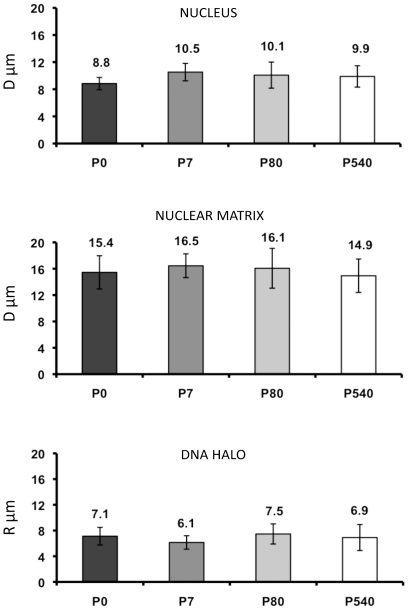
Figure 2. Average diameter (D) of the nucleus and the NM, and average radius (R) of the corresponding nucleoid-DNA halo from P0, P7, P80 and P540 rat neurons.
Bars represent the corresponding standard deviations of measurements carried out under phase contrast (nuclei and NM) and fluorescent (DNA halo) microscopy at 40×. See Table 2 for statistical analysis of data, n = 50 for each set.. The data sets for P7 and P540 were taken from our previous work [21]. The corresponding average DNA loop size can be deduced from the measurement of the DNA halos as it has been previously described [20]: P0 = 42 kbp±4.02; P7 = 36 kbp±3.05; P80 = 44 kbp±4.6; P540 = 40.6 kbp±5.9.

