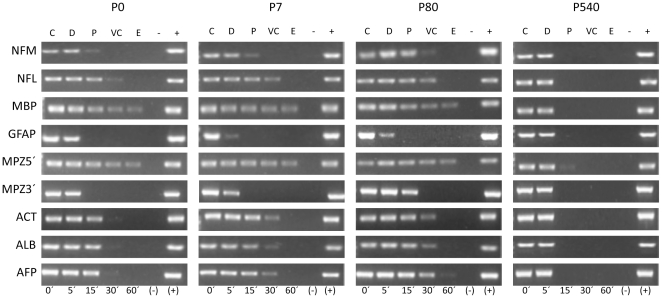
Figure 4. Representative amplification pattern of the chosen nine target sequences corresponding to the eight genes mapped to topological zones relative to the NM.
Middle neurofilament (NFM), light neurofilament (NFL), myelin basic protein (MBP), glial fibrillary acidic protein (GFAP), myelin protein zero 5′ region (MPZ5′), myelin protein zero 3′ region (MPZ3′), beta-actin (Act), albumin (Alb), alpha-fetoprotein (Afp). The amplicons were scored as positive or negative by an image analysis system (Kodak 1D Image Analysis Software 3.5 system) using its default settings and thus positioned within the specific topological zones defined according to the corresponding kinetics of nucleoid-DNA digestion (Fig. 4). C = control (0′ digestion time), D = distal to the NM, P = proximal to the NM, VC = very close to the NM, E = embedded within the NM. (−) Negative control without DNA template. (+) Positive control with genomic DNA. P0, P7, P80 and P540 indicate the age of the neuronal nucleoid donors (n≥4).

