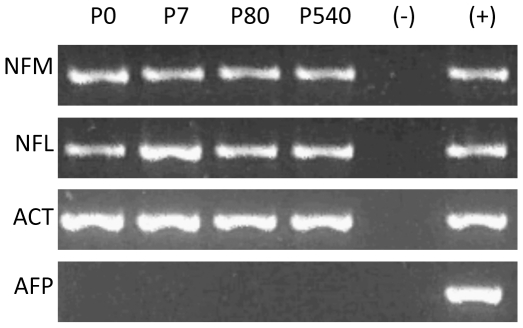
Figure 5. Reverse transcriptase-PCR analysis of mRNA (RT-PCR).
The results show the expression of two neuron-specific genes (NFM, NFL) whose position relative to the NM in post-natal neurons was previously mapped (Table 5). ACT is included as control for gene expression in the cerebral cortex. AFP is not expressed in the cerebral cortex and it remains so. The results suggest there is no overt change in neuronal transcriptional activity with age. (−) Negative control. (+) Positive control.

