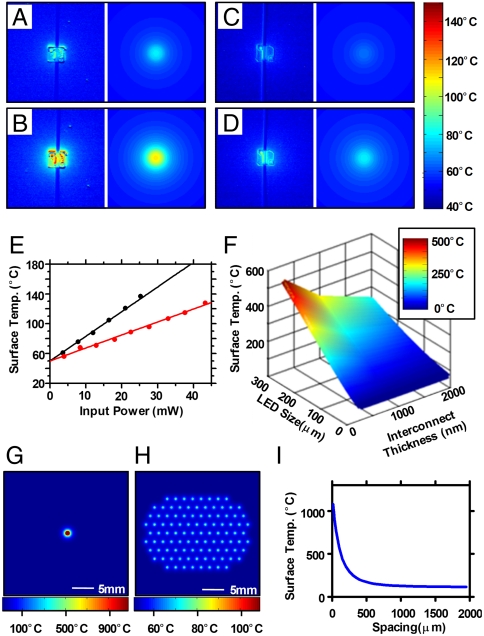
Fig. 5.
(A–D) Temperature distributions for isolated InGaN μ-ILEDs with Al interconnects [300 nm and 1,000 nm-thick for (A–B) and (C–D), respectively] at input powers of (A) 7.8 mW, (B) 16.4 mW, (C) 8.4 mW, and (D) 18.0 mW captured using a QFI Infra-Scope Micro-Thermal Imager (left) and calculated by analytical models (right). (E) Surface temperature for μ-ILEDs with Al interconnect thicknesses of 300 nm (black) and 1,000 nm (red) extracted from experiments (dots) and computed using the analytical model (lines) as a function of input power. (F) Three-dimensional plot of the surface temperature as function of device size and interconnect thickness, at a constant heat flux of 400 W/cm2. Temperature distribution for (G) a macrosize LED (i.e., 1 × 1 mm2), and (H) an array of 100 μ-ILEDs (i.e., 100 × 100 μm2) at a spacing of 2 mm. (I) μ-ILEDs surface temperature vs. spacing for an array of 100 μ-ILEDs.

