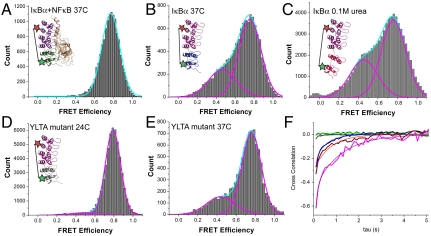
Fig. 4.
(A) smFRET histogram of the IκBα–NFκB complex at 37 °C demonstrating that binding NFκB to IκBα completely suppressed the low- to mid-FRET populations observed for free IκBα, even at the higher temperature. The inset illustrates the IκBα–NFκB complex (ARs 5–6 in green) and the placement of the fluorophores, which are represented by stars (only one of two possible ways the protein could be labeled with two different dyes is depicted). (B) In the absence of NFκB, the IκBα fluctuations, and hence the low-mid-FRET efficiencies, increased at 37 °C. The inset depicts an extended IκBα in the absence of NFκB at 37 °C, with ARs 5–6 in blue. (C) smFRET histogram of free IκBα in 0.1 M urea shows a marked increase in the mid-FRET population. The inset represents a schematic of an extended IκBα in the presence of 0.1 M urea, with ARs 5–6 in red. (D) smFRET histogram of N-terminally His-tagged YLTA mutant IκBα at 24 °C. The lower-FRET population is greatly suppressed compared to the wild-type, despite the higher temperature. The inset illustrates the stabilized YLTA mutant with ARs 5–6 in gray. (E) At 37 °C, the YLTA construct begins to show a lower-FRET population. (F) Cross-correlation plot averaged over the traces in each condition quantifies the degree of fluctuation. Smooth curves represent single-exponential fitting. The green and gray curves correspond to NFκB-bound and YLTA mutant IκBα; the blue curve corresponds to native IκBα at 37 °C; and the red and magenta curves correspond to IκBα in 0.1 and 0.5 M urea, respectively. The insets in A–D depict the molecules in the same color scheme.

