Fig. 3.
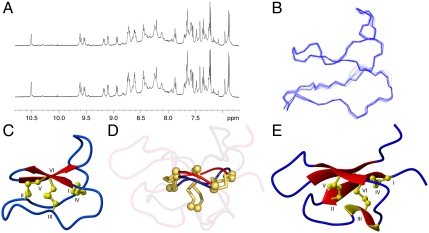
NMR spectra and 3D structures. (A) 1H spectra of Cter M recorded before (top) and after (bottom) heating to 95 °C for 5 minutes. (B) Superposition of the 20 lowest energy structures of Cter M. (C) Overview structure of Cter M. Strands are shown as arrows, helical turns as thickened ribbons, and disulfide bonds in ball-and-stick format. (D) Superposition of Cter M and PA1b highlighting the cystine knot motif; disulfide bonds are yellow and αC atoms are represented by spheres. (E) Structure of PA1b. The PDB ID code for Cter M is 2LAM and for PA1b is1P8B.

